Paper of the month: Neutrino tomography of the Earth
A recent analysis done by A.Donini et. al [1] measures the density profile of the Earth using atmospheric neutrinos.
Even though neutrinos are weakly interacting particles, cosmic rays scattering with the nuclei of the atmosphere produce a high energetic neutrino flux with a non-negligible probability to interact with the nucleons of the Earth, when passing through it. Using a one-year muon data set measured by the IceCube neutrino telescope [2], it is possible to infer the Earth’s density profile. This method provides a new way to study Earth’s internal structure and although the idea is not new, this work represents the first attempt at applying it using actual data. This is the first time we can actually see the interior of the Earth by means of neutrino tomography and obtain non-trivial results.
April 24, 2018 by RebecaBV
The knowledge about the structure of the Earth comes mainly from seismological data [3, 4]. Although there are millions of earthquakes every year and the study of the propagation of seismic waves is a well established method to measure the density of the Earth, its determination is a non trivial problem, being especially difficult the determination of the core’s density, that would benefit from complementary information. Given the relevance in understanding the Earth’s internal dynamics and evolution, using a completely different technique to infer the Earth’s density distribution is important. The method used in [1] is based on the study of the atmospheric neutrinos that travel through the Earth.
An isotropic flux of high energetic atmospheric neutrinos is produced when cosmic rays, high energetic particles coming from outer space, interact with the atmosphere. Although neutrinos interact very rarely, for energies around and above a few TeV the interaction rate of neutrinos with nucleons is large, being the Earth partially opaque for them. The more energetic is the neutrino and the bigger the number of nucleons along its path through the Earth, the higher the probability of undergoing inelastic scattering and get absorbed. That will imprint a dependence in the observed flux with both the energy and zenith angle with respect to the detector, see Fig. 1. By studying this attenuation it is possible to do a “radiography” of the Earth.
This work is based on a one-year muon sample of the IceCube telecospe [2]. IceCube is a km3 neutrino detector based in the South Pole capable of measuring the Cherenkov light emitted by muons traveling through it. These muons are produced when neutrinos, after traversing the Earth, interact with the ice surrounding the detector. The energy and direction of the incoming neutrinos can be extracted from the direction and energy deposited by the muons. The density profile of the Earth obtained using this data is shown in Fig. 2.
The fascinating part of this method is that they are able to determine the mass of the Earth and its moment of inertia using weak interactions only, independent from gravitational measurements. After parameterizing the Earth’s density profile, the mass of the Earth as weighed by neutrinos is given by Mν⊕ = (6.0+1.6 −1.3)×1024 kg, while the gravitational measurement up to date is Mgrav ⊕ = (5.9722 ± 0.0006) × 1024 kg. The resulting moment of inertia Iν⊕ = (6.9±2.4)×1037 kg m2 is also in agreement with Igrav⊕ = (8.01736±0.00097)×1037 kg m2.The mass of the Earth’s core has been estimated to be Mνcore = (2.72+0.97 −0.89)×1024 Kg which is a bit bigger than the result from geophysical density models, which estimate it to be ∼ 33% of the total Earth mass. Using neutrinos they are also able to confirm that the core is denser than the mantle, which is necessary for the Earth to be gravitationally stable (please see pdf attached).
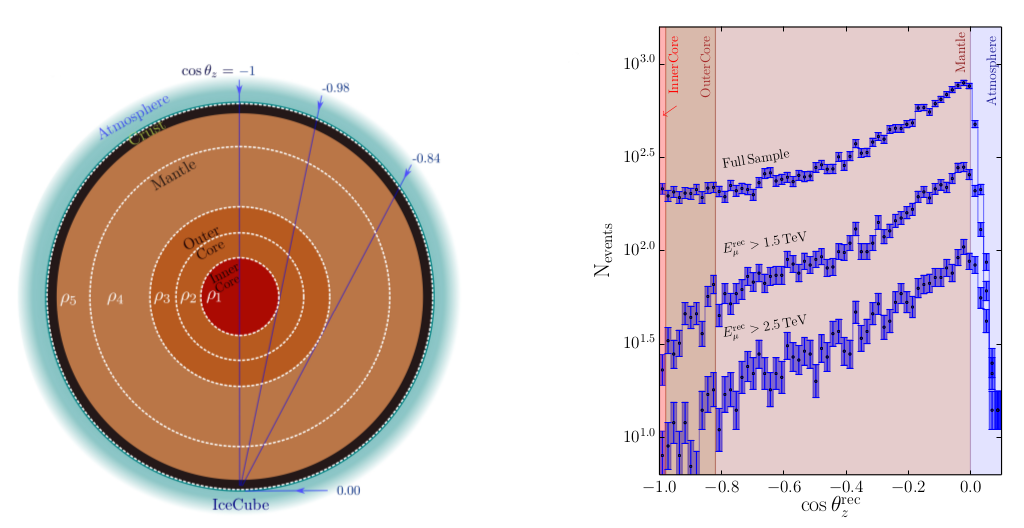
Figure 1: Left: representation of the five layer model used in [1] along with the most representative neutrino trajectories. Right: Number of events as a function to the zenith angle for different energies of the one-year muon sample measured by IceCube [2].
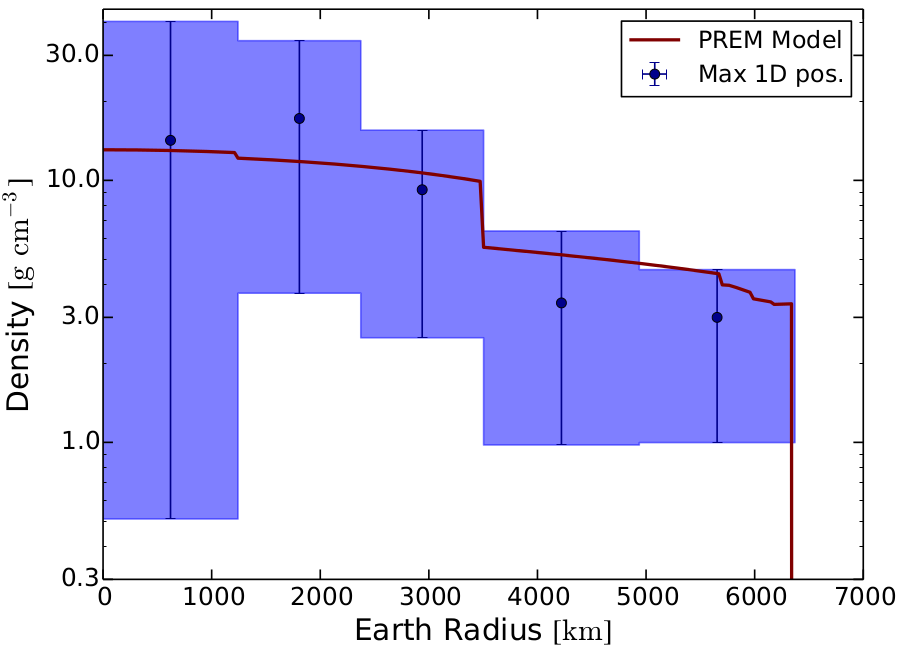
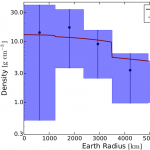
Figure 2: Density profile determined by atmospheric neutrinos. The blue dots represents the values of the fit for a flat layer model and the purple curve represents the fitted density profile to the PREM model [5].
Although the uncertainties obtained with this method are yet very large, the results agree very well with the ones computed with the usual techniques, and they will improve considerably as soon as more data is released.
Text by Álvaro Hernandez Cabezudo (KIT) and Elena Perdomo Mendez (SOTON)
References
[1] A. Donini, S. Palomares-Ruiz and J. Salvado, arXiv:1803.05901 [hep-ph].
[2] M. G. Aartsen et al. [IceCube Collaboration], Phys. Rev. Lett. 117 (2016) no.7, 071801 doi:10.1103/PhysRevLett.117.071801 [arXiv:1605.01990 [hep-ex]].
[3] B. L. N. Kennett, Geophys. J. Int. 132, 374 (1998)
[4] G. Masters and D. Gubbins, Phys. Earth Planet. Inter. 140, 159 (2003)
[5] A. M. Dziewonski and D. L. Anderson, Phys. Earth Planet. Interiors 25, 297 (1981)
© ELUSIvES PROJECT 2016