Paper of the month: Planck intermediate results. XXX. The angular power spectrum of polarized dust emission at intermediate and high Galactic latitudes by R. Adam et al.
November 5, 2014 by tiinatimonen
In this paper, the Planck collaboration presents measurements of the polarized dust angular power spectra. Dust is considered the main background of B-modes at some of frequencies at which the BICEP2 experiment is operating (150 GHz). However, the BICEP2 collaboration found that the galactic dust cannot explain by itself their measurements, claiming therefore an observation of primordial B-modes.
Despite the generalized excitement, some previous studies in literature have already re-assessed all the systematic errors and possible unaccounted-for foregrounds (as dust polarization), concluding that the resulting joint BICEP2 plus Planck analysis favors solutions without gravity waves (Mortonson and Seljak, JCAP 2014).
.png)
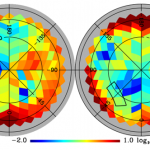
Planck dust map.
In this paper, the Planck collaboration has presented measurements of the B-modes, extrapolating their results from 353 GHz to 150 GHz. The plot shows the dust map from Planck of the whole sky (north and south hemisphere, respectively) measured at 353 GHZ and extrapolated to 150 GHZ. Dust contamination is increasing from blue to red, and the BICEP2 region is marked by contour.
The previous plot shows that there are actually cleaner regions in the sky, which could be useful for future experiments of this kind. The Planck collaboration made also an analysis of the available BICEP2 data with their new maps. The results can be seen the following plot.
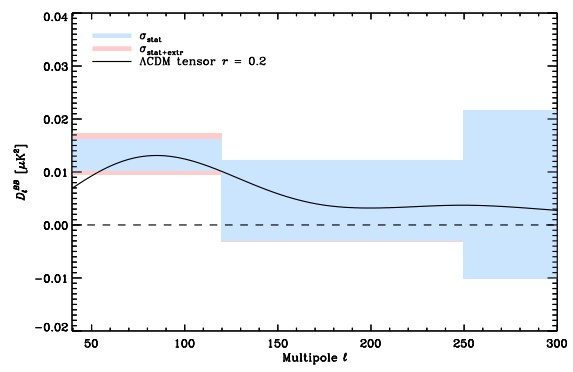
On this plot the black line indicates the signal of BICEP2, while the blue area shows the measurement of dust by Planck.
The conclusion is then that the measurements of BICEP2 could be, in principle, explained by a dust component only. However, given the fact that systematic uncertainties on the polarized dust signal are currently large, a joint analysis of the Planck and BICEP2 is a mandatory first step before a final interpretation of the BICEP2 B-mode measured signal.
Text by Ignacio Hierro and Kirill Kanshin
© ELUSIvES PROJECT 2016