Paper of the month: Precision measures of the primordial abundance of Deuterium
September 23, 2013 by admin
So, how much deuterium was there in the primordial phase of our Universe?
This information can tell us how much atomic matter (i.e., baryons) there is all in all in the Universe today! This latter quantity has recently been measured with great precision by the Planck satellite, according to which baryonic matter constitutes only the
(2.205 ± 0.028) / h2 %
of the Universe, where h stands for the Hubble constant in units of 100 (km/s)/Mpc and it is a number around 0.7, with a large uncertainty. It would be great if this determination could be corroborated by another, completely independent one, e.g. from a measure of deuterium's primordial abundance.
Astrophysicists have known for a long time how to measure the abundance of deuterium created during big bang nucleosynthesis. The basic idea is to look for some gas cloud situated so far away in the cosmos that we see it as it was about 11 billion years ago, which corresponds to the time the light took to reach us from there. Now, if there is some light source behind it (most likely a quasar) we can observe the absorption lines of the chemical components of the cloud in the observed spectrum, and infer from their intensity the relative abundance of such components, and in particular the ratio of deuterium over hydrogen ( D/H ).To do this, a special category of clouds is the most indicated: they are called metal-poor Damped Lyman-α (DLA) systems and are mainly composed of hydrogen, with a minimum concentration of metals, which would hide the characteristic Lyman-α lines in the H absorption spectrum. In the sky we have seen several thousands of them!
But can this method be precise enough to compete with the measure by Planck? The answer is yes, also thanks to the recent discovery of the most metal -poor DLA, which points towards the quasar QSO SDSS J1358+6522. In this paper, an accurate analysis of the absorption spectra of this plus other 4 high quality selected DLAs is performed. The result is a primordial abundance of deuterium of
log( D/H ) = -4.597 ± 0.006
which corresponds to a baryon fraction
100 Ωb0 h2= 2.202 ± 0.019 (statistic) ± 0.041 (systematic)
This is definitely in agreement with the Planck measure!
Is this all? Actually not, because from the primordial density of deuterium one can do even more: for example, extracting the number of the effective species of neutrinos existent in nature. We have observed only 3 so far but ... is there room for a 4th one?! Well, combining their deuterium determination with Planck observations of the Cosmic Microwave Background, the value obtained by Cooke et al. is
Neff = 3.28 ± 0.28
which rules out a 4th specie at 99.3 % CL (2.7σ).
At the state of art the main limitation in using this extremely precise measurement of the primordial deuterium abundance in the estimation of cosmological parameters such as Ωb0 and Neff is the relative lack of experimental measures of some key nuclear reactions occurred during big bang nucleosynthesis. In future improved measurements of these reaction rates will pin down the value of Neff and shed light on the physics beyond the standard model.
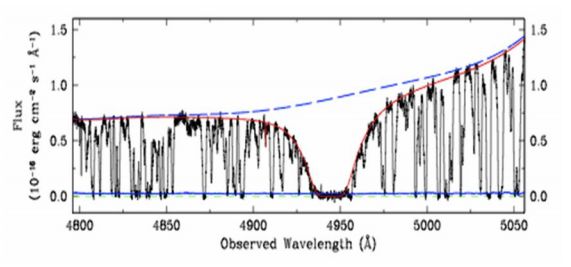
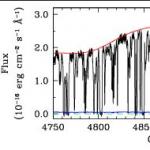
*Figure: the spectrum (black line) of the most distant DLA system included in this analysis. The solid blue line depicts the error spectrum, the dashed green line marks the best-fitting zero level of the data. The dashed blue line shows the best-fitting continuum level, while the solid red line shows the overall best-fitting model to the DLA.
Text by Maria Archidiacono and Ilaria Brivio

© ELUSIvES PROJECT 2016